Why Your Swiggy ETA Jumps Mid-Order — The 4 ML Models Behind "35 Min Delivery"
That mid-order ETA bump is not random. It is the result of four independent prediction legs being stitched together and partially re-run when real-time signals diverge.

"35 min delivery" is not a number. It is four independent ML models pretending to be one number.
You have seen it happen. Swiggy says 35 minutes. You wait. At some point, mid-order, it quietly jumps to 48 minutes. No explanation. Just a bigger number.
Most people assume it is a bug, or that Swiggy is just being conservative. The reality is more interesting: that bump is the result of real-time signals diverging from four separate prediction models that were stitched together when you placed your order.
This post breaks down exactly how it works, and how Swiggy and Zomato do it differently.
The Core Insight: One Number, Four Models
Marketplace dynamics: is there an exec available to take the order?
Road traffic: how fast can the exec move through the city?
Restaurant operations: how fast is this specific kitchen working right now?
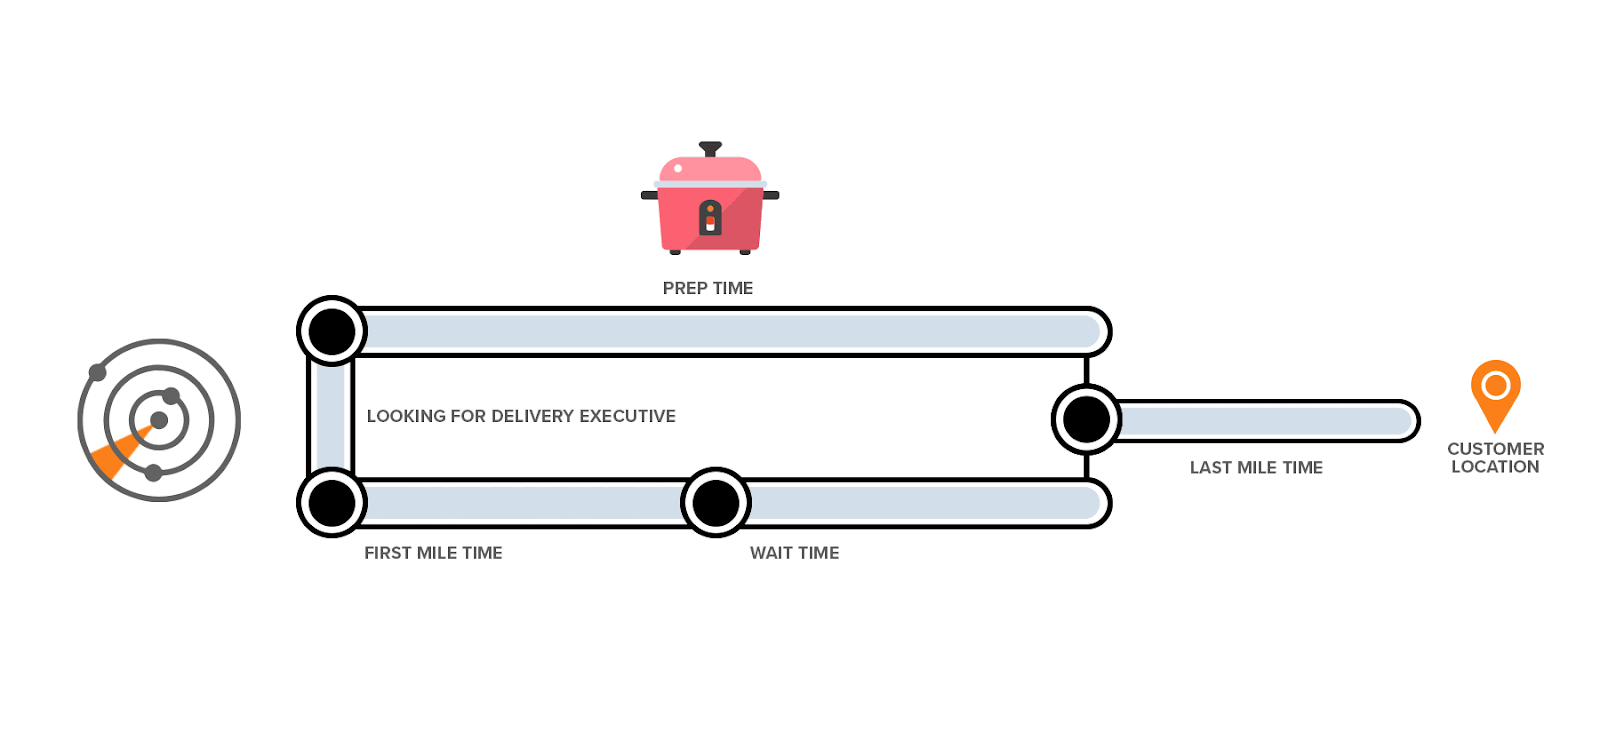
The Four Models — What Each One Actually Does
Model 1: Order-to-Assignment
Model 2: First Mile
Model 3: Restaurant Wait Time
Model 4: Last Mile
How the Final ETA Is Computed
Why the ETA Bumps Mid-Order
Traffic worsens because a jam appears on the route
Restaurant stress spikes because the kitchen starts falling behind
The exec gets stuck, delayed, or takes a detour
When real-time signals diverge significantly from the initial prediction, the platform re-runs the affected legs. If the new total exceeds the original by more than a threshold, typically around five minutes, it triggers a bump: the ETA update you see on screen.
Critically, not all four legs are re-predicted. Assignment and First Mile are usually locked by the time a bump occurs. Only WaitTime and LastMile remain live until pickup and dispatch are clearer.
Example:
T+0 Initial prediction -> 35 min
stress_signal = 0.7
traffic_factor = 1.8x
T+8 Real-time update
stress_signal -> 0.95
traffic_factor -> 2.4x
WaitTime re-predicts: +5 min
LastMile re-predicts: +3 min
New total -> 43 min
Swiggy's Bump Quality Metric
Swiggy vs. Zomato — Same Number, Different Architecture
Swiggy: four explicit leg models stitched together
Zomato: a more layered stack with prep-time and delivery ETA modeled separately plus dynamic buffering
Prep time: Swiggy treats it as one ETA leg, while Zomato invests more deeply in a standalone Bidirectional LSTM
Last mile: Swiggy uses its own model stack, while Zomato leans heavily on delivery-partner GPS and tree-based delivery ETA logic
Maps: Zomato enriches open maps using its own delivery-partner pings to reconstruct roads and find shortcuts missing in dense Indian areas
Explainability: Swiggy emphasizes debugging and bump quality, while Zomato emphasizes per-window ETA compliance and route enrichment
Zomato's map enrichment is especially clever. OpenStreetMap is incomplete in many dense Indian zones, so delivery-partner GPS traces can be used to reconstruct missing roads and last-mile shortcuts. Same user-facing number, very different backend investment.
The Go Prototype
What the prototype does:
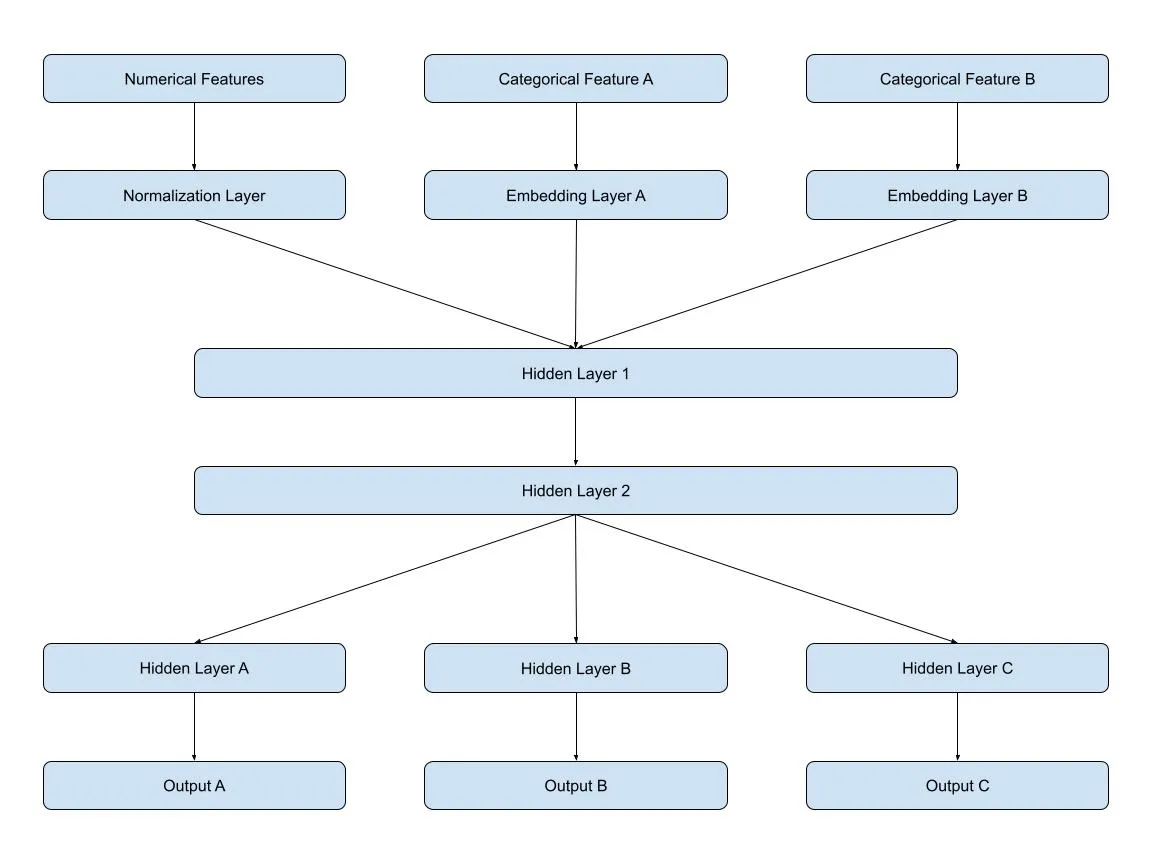
Takes an
OrderContextas input with fields like exec distance, traffic factor, queue depth, and stress signalRuns all four leg functions independently
Stitches them into a final ETA breakdown
Accepts updated real-time signals in a second call
Re-runs only
WaitTimeandLastMileEmits a bump event if the delta exceeds threshold, including trigger leg and reason
Sample output:
text=== ETA Engine: Order #8821 ===

[Model 1] Assignment      ->  5.0 min  (supply_ratio: 0.37, peak: true)
[Model 2] First Mile      ->  7.6 min  (dist: 1.4km, traffic: 1.8x)
[Model 3] Restaurant Wait -> 23.6 min  (queue: 6, stress: 0.70)
[Model 4] Last Mile       -> 20.3 min  (dist: 2.1km, junction_penalty: +8min)
--------------------------------------
         Quoted ETA        -> 57 min

T+8: Real-time divergence detected
   Restaurant stress: 0.70 -> 0.95
   Traffic factor:   1.80 -> 2.40

[Model 3] Wait (revised)  -> 27.6 min  (+4.0)
[Model 4] Last Mile (rev) -> 25.1 min  (+4.8)
--------------------------------------
         Revised ETA       -> 66 min   BUMP (+9 min)
   Trigger: WaitTime + LastMile divergence
   Reason:  restaurant_stress_spike + traffic_divergence
Key Takeaways
The next time your ETA jumps, you will know exactly which model changed its mind, and why.